Fig. 1 – Representative conventional CT fatigue graph.
History
As recently as 2017, mid- to high-strength (100,000 to 130,000 psi) conventional coiled tubing was still the majority string material used by coiled tubing service companies. However, Q&T coiled tubing has been a commercially available product since 2015. Even with great care, conventional coiled tubing strings suffer from fatigue spikes at the bias welds while the parent material has lower fatigue, as seen in Fig. 1, and the seam weld itself is highly susceptible to corrosion causing pinholes or fracture initiation (Fig. 2).
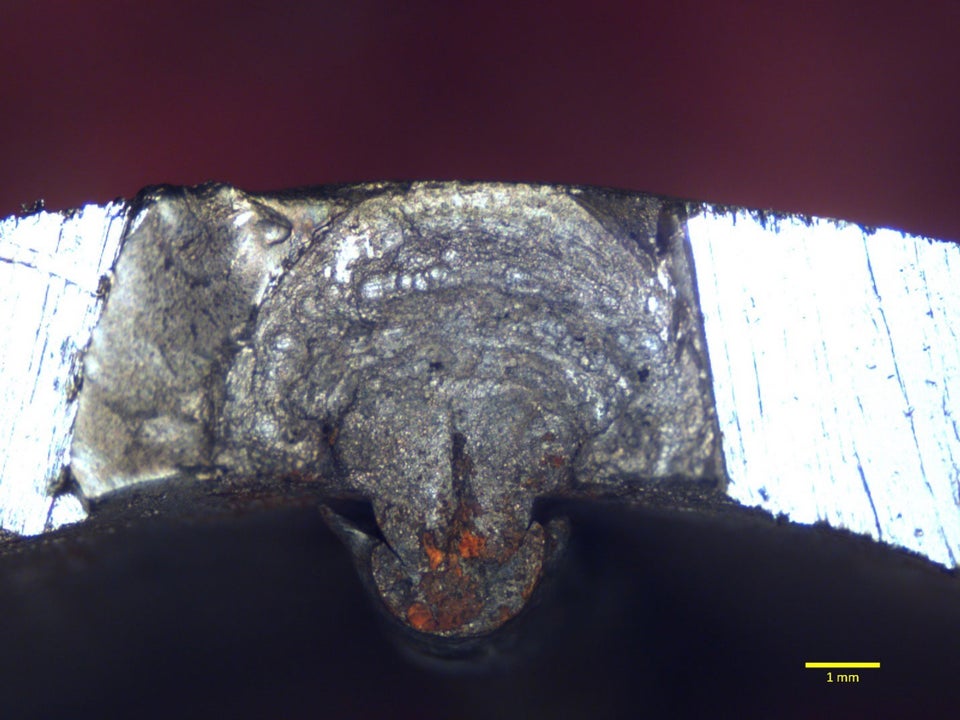
Fig. 2 – Seam weld fracture initiation site.
These two factors concerning the health around the welds contributed to the exploration and production (E&P) companies setting running footage and fatigue “rules of thumb” that the service companies had to abide by. While these varied somewhat from customer to customer, a consensus was a maximum of 40% fatigue (at the highest point) and/or 400,000 running ft, often referenced as the 40/400 rule.
The data from Table 1 supports the E&P companies' justification for setting string limits. When service companies tried to push the boundaries above the 40/400 limit, parted tubing and an increase in pinholes were often the result. This caused costly delays in swapping units out and fishing strings from a well or creating health, safety, and environmental (HSE) issues with the unintentional release of fluids at the surface.
String Care
As the cost of replacing strings increased due to string cost itself and associated downtime, service companies were eager to find solutions to improve the useful life of the tubing. These included, but were not limited to, carefully matching the string to the job at hand, real-time weld location monitoring during the job, and post-job corrosion and biocide treatments.
To achieve the most life from a string, a service provider would review fatigue graphs from its available strings and match one to the job expected to be performed. This technique ensured the strings met the customers' requirements while extending the life by placing expected fatigue in areas of the sting that were underused. While this technique was, and still is, effective, the issue arises where a field or play was, and is, developed, all the wells were drilled relatively the same with the same job type needing to be performed. For example, milling frac plugs on a 10,000-ft vertical well with a 10,000-ft horizontal section. This similarity negated matching the string to the well as all strings had fatigue in the same location.
Monitoring weld locations was the next advancement in extending life. While electronic systems had existed for some time, little emphasis was taken. Operators would often not pay attention to the systems during the job and would cycle the tubing at a weld with high pumping pressure, accelerating the fatigue on a weld. Another common issue was inaccurate information entered into the systems regarding footage removed from the whip end from mismeasurement or forgetfulness to enter anything. To combat this inaccurate information, engineers were sent to the field to set up the job in the computer system and accurately update the system's string file, along with operator training on how and when to cycle the tubing.
Through analysis of failed strings, service companies noticed a pattern arising from microbial-induced corrosion (MIC) contributing to pinholes and general corrosion pitting leading to parted strings (pitting creates a stress riser, Fig. 3). These issues were magnified by E&Ps using recycled water to reduce completion costs. Service companies began developing and performing post-job treatments on strings with specialty biocides and corrosion inhibitors to mitigate the use of recycled water. These treatments were somewhat effective in preventing issues, provided the field personnel implemented them correctly.
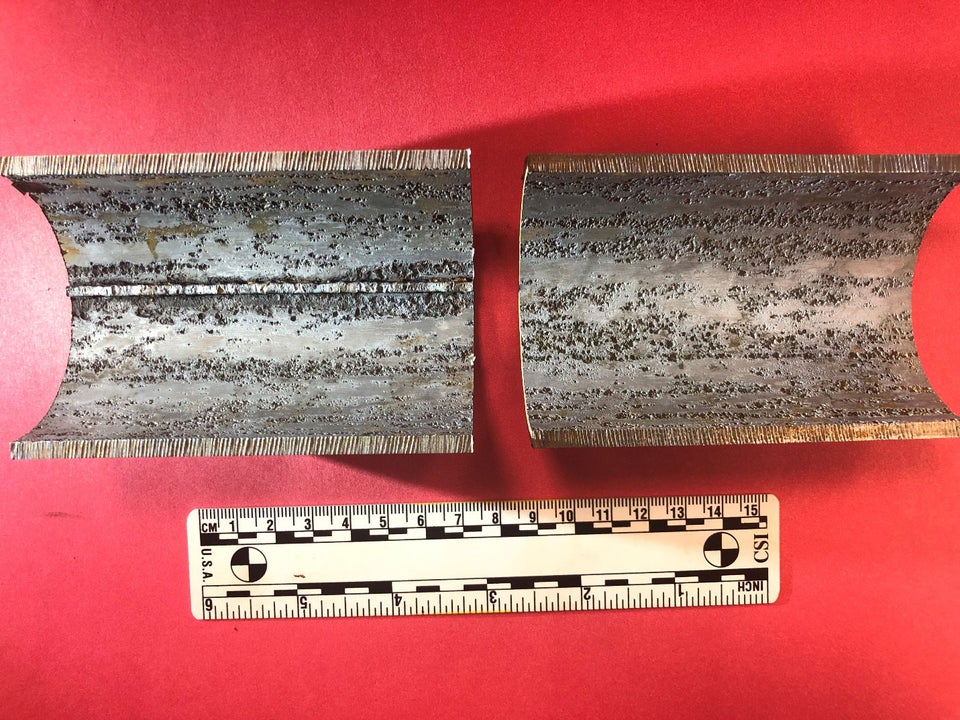
Fig. 3 – Conventional coiled tubing internal pitting, with string care measures.
While these three string care steps did result in running footage improvements before issues arose, as noted in Table 2, the significance of improvements was minimal in the eyes of the E&Ps and, therefore, largely ignored.
With the E&Ps not deviating from the established rules of thumb, many service companies did not see any significant financial improvement from the increase in use as it was often offset by the cumulative cost of biocide and corrosion treatments over the string's life. However, these lessons learned would soon play a substantial role in the evolution of string manufacturing.
Quenched and Tempered Coiled Tubing
Recognizing the needs of the service companies and seeing what was being done by them to extend string life, tubing manufacturers began the quest for a different parent material or manufacturing process. When manufacturing conventional strings, the seam weld and the associated heat-affected zone (HAZ) are tempered to relieve stress and soften the weld itself to prevent brittle fractures as the tubing experiences bending while in use.
It was determined that if the seam weld can be tempered to relieve stress, then, with the advancements in induction heating technologies coming to the market, so could the entire string. Looking to the steel industry and knowing the specific needs of coiled tubing, various materials were exposed to the Q&T process and tested. As one JPT[1] article notes, “…laboratory testing showed that gains in fatigue life of more than 50% compared with conventional CT could be expected."
The first Q&T coiled tubing products were made commercially available in 2015 and quickly made a noticeable impact in the market. “In field-deployed and retired Q&T strings, the average increase in running footage after failure or voluntary retirement is approximately 45% greater than for conventional CT.” (JPT[1]) The increase in performance is directly related to the homogeneous grain structure throughout the string, removing the effects of HAZ and reducing the likelihood of MIC occurring within the HAZ. When presented with laboratory and field data, E&Ps realized this was a significant step-change and initially began to remove or change the rules of thumb they had been operating under for years.
While this theoretical 45% increase in running footage was considerable, it did not prove to be the solution to driving financial performance increases for the operator as the Q&T strings are more expensive than conventional strings. As noted in Table 3, not every service company necessarily saw theoretical results. Fig. 2 is a representative fatigue graph of a Q&T string at retirement.
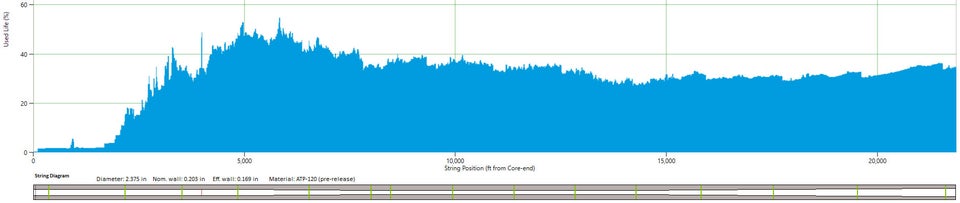
Fig. 2 – Representative Q&T CT fatigue graph.
Service companies began pushing the envelope of running footage and fatigue to realize the economic benefits of the Q&T strings. As the JPT[1] article denotes, “when the maximum achieved running footage relative to conventional grades is considered, Q&T products retire at 70% higher running footage, an observation supported by data from the Eagle Ford, Permian, and Bakken plays.”
While the 70% higher utilization rate was achievable, many service companies were experiencing numerous string failures while attempting to achieve these high utilization numbers. E&Ps again implemented rules of thumb for service companies to follow, although this time vastly varying from customer to customer and sometimes from field to field. Service companies, desperate to repair their reputations, looked to the tubing manufacturers themselves for help.
Tubing manufacturers noticed that the number of string failures directly related to seam and bias welds had drastically reduced. However, they still occasionally happened, and it was suggested to implement the lessons learned while trying to achieve high conventional tubing footage.
The Magic Combination
Once service companies began to treat the Q&T tubing in the same manner as they did with the conventional tubing, it was proven that substantial performance gains could be realized. These gains far exceeded the 70% running footage increases many in the industry were seeing, as noted in Table 5.
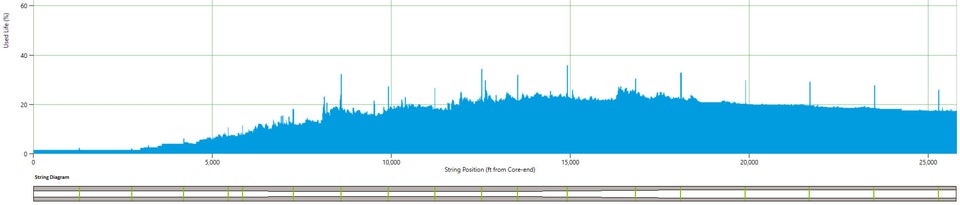
The data shows that when Q&T strings are adequately cared for, 200-300% increases in running footage than conventional tubing are achievable without failure. Fig. 3 is the fatigue graph from the 1.5-million running ft string (from Table 5 above) at retirement.
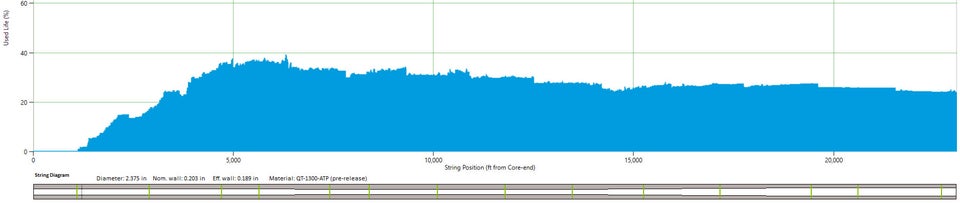
Fig. 3 – 1.5-million running ft fatigue graph.
String optimization partnerships between the tubing manufacturers and service companies have also proven to be immensely enlightening. This process involves the service company sending in 1- to 2- ft pipe samples from the whip end pre-job and post-job to be analyzed in the tubing lab for any factors that contribute to failure, specifically corrosion-related. Then adjustments are made to their tubing care procedures and/or chemicals. Fig. 4 shows an example of an optimized corrosion treatment. If a bias weld is sent in, and at least every 10 samples, the tubing sample is fatigue tested to estimate the remaining life of the string.
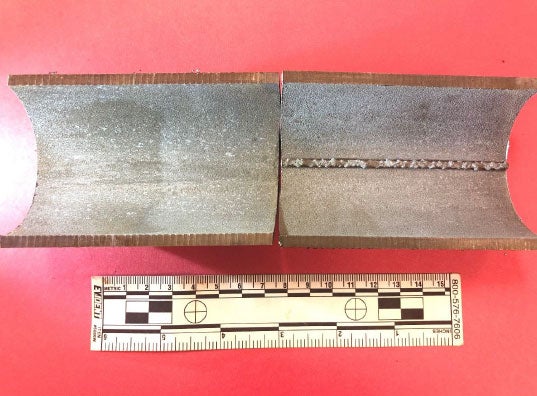
Fig. 4 – Q&T coiled tubing with optimized corrosion treatment.
Once the 1.5-million running ft string (from Table 5 and Fig. 3) was retired, numerous samples throughout the string were taken. Lab testing (Fig. 5) showed that theoretically, this string could have been pushed to around 1.5 times its current fatigue before a failure at bias weld 11 would have occurred, for an estimated 2.25 million running ft at 100% utilization and 1.8 million running ft with a 20% safety factor. This assumes all future jobs and string care would be relatively similar to the previous job and care history this string saw.
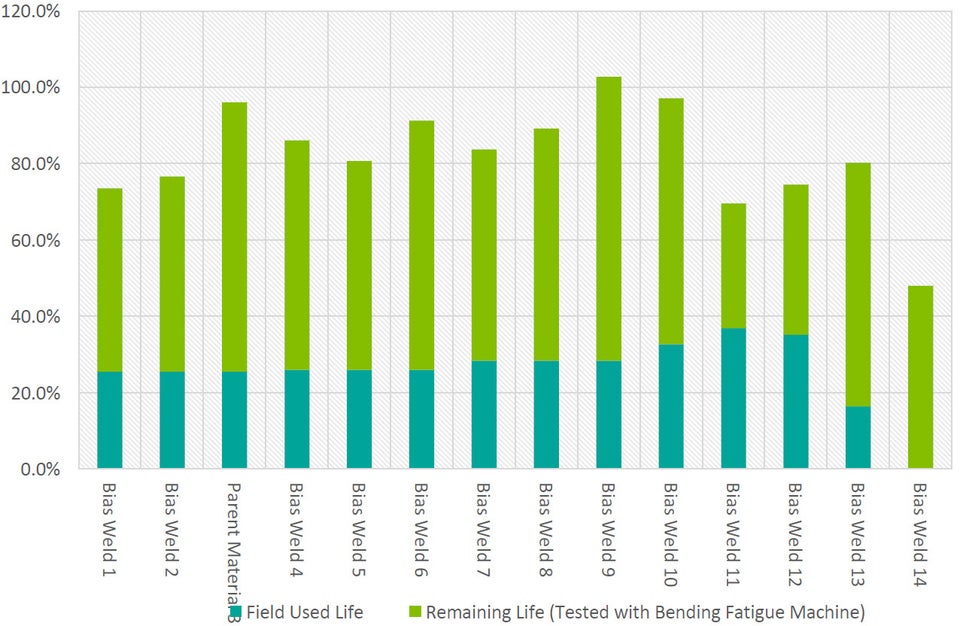
Fig. 5 – Remaining life of 1.5 million running foot string, lab testing.
Conclusion
While fatigue and running footage were historically the only factors to choose coiled tubing units for jobs, today, these are only a portion of what service companies and E&Ps need to consider. Service companies have taken great strides to improve performance for the E&Ps and should be rewarded with string care and tubing type now being additional considerations. Coiled tubing providers are routinely achieving 800,000 running ft from Q&T strings across the board, and some are retiring strings at 1 million-plus running ft, with low failure rate percentages in the field. This is more than just a step change from the historical conventional string 2017 performance of 400,000 to 500,000 running ft and is a winning combination for both operators and E&Ps.
[1] https://jpt.spe.org/line-quench-and-temper-technology-applied-ct-improves-safety-and-reliability